A Spirograph is a toy that produces geometrical patterns. I am very sure that you would have seen this at least seen this once in your childhood. It can produce beautiful patterns with very little effort. Did you know that all of this is based on simple mathematics?
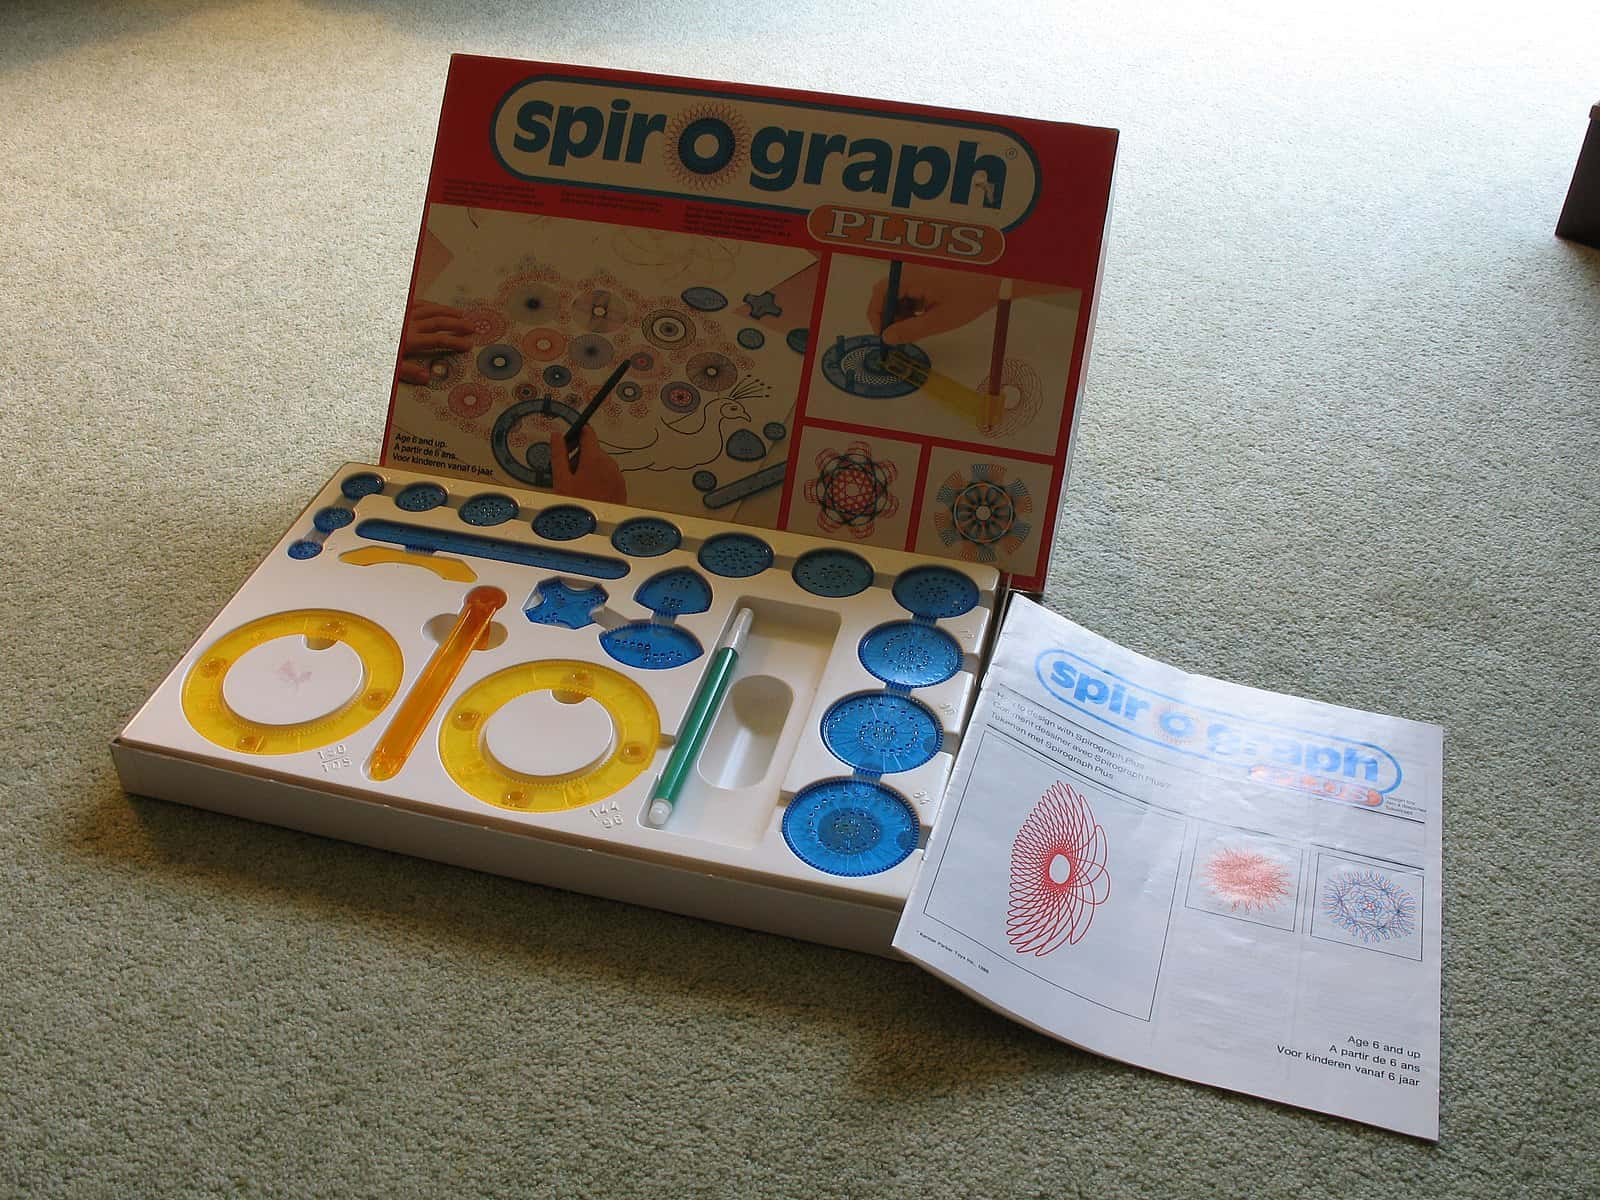
Image Courtesy: James Petts from London, England [CC BY-SA 2.0], via Wikimedia Commons
.jpg)
Spirographs produce curves known as hypotrochoids and epitrochoids depending on various parameters passed to the parametric equation that defines them. Even though this sounds too technical, the math governing this is actually simple.
Here's a visualisation to understand how spirographs work. By changing the radii of the circles and the distance of the point(the orange dot) relative to the center of the circle, different spirographs can be generated.
Let's now try and do that with JavaScript and HTML Canvas.
For an epitrochoid, the parametric equation is given by:
x(θ) = cx + (R + r) * cos(θ) - d * cos(θ × ((R + r) / r))
y(θ) = cx + (R + r) * sin(θ) - d * sin(θ × ((R + r) / r))
and for a hypotrochoid,
x(θ) = cx + (R - r) * cos(θ) - d * cos(θ × ((R - r) / r))
y(θ) = cx + (R - r) * sin(θ) - d * sin(θ × ((R - r) / r))
Plotting these, we get
Play around with the input sliders and see what patterns you are able to generate! Here are some that I managed to generate.
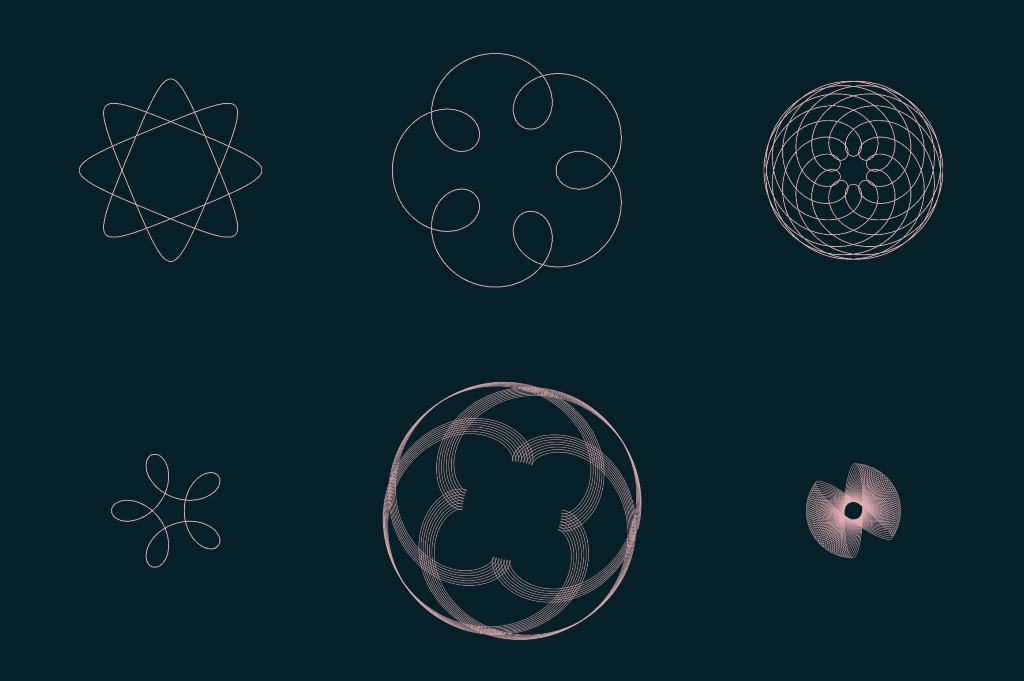
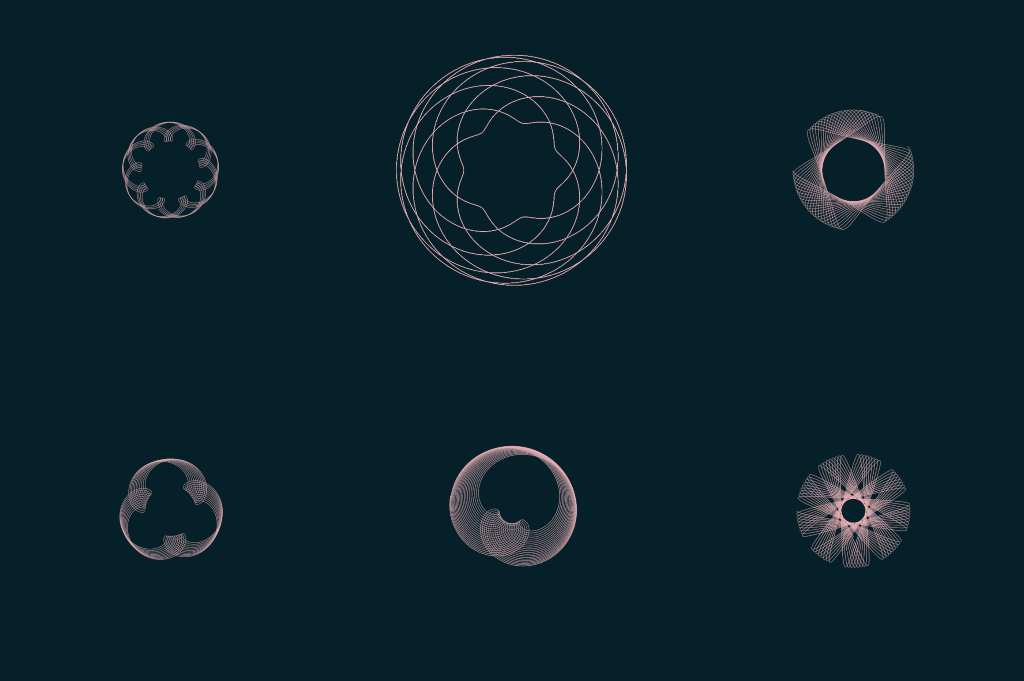
I am surprised that it's possible to generate even triangles with this even though the driving shape behind this are circles.
The code behind this is hosted on GitHub. Feel free to check it out in case you are interested.